
Stand Up Your Forecast Process
Why and How Forecast 360 Was Born
Forecast 360 wasn’t created because we needed another dashboard. It was created because the way we were forecasting was fundamentally broken.
At the time, forecasting was being run through Salesforce using a workaround that most organisations will recognise. Leaders relied on fake placeholder opportunities to apply judgement on top of pipeline totals. Those totals were built from weekly snapshots, meaning that by the time regional or geo-level forecast calls took place, the data on screen was already five days out of date.
As the business moved faster, the gap between reality and reported numbers kept widening.
On forecast calls, I repeatedly heard the same frustration:
“The numbers have changed since we submitted.”
“We can’t compare what we’re discussing to what’s on the screen.”
Leadership, Sales Operations, Finance and Supply Chain were all impacted. We were spending more time explaining discrepancies than making decisions.
That was the trigger.
What Was Broken With the Old Approach
The existing process forced leaders to manage judgement separately from the actual pipeline.
District leaders would take the total value of deals in Billed, Booked and Commit stages, then manually offset perceived risk using a single judgement opportunity. If they believed there was £1m of risk in a £10m number, they entered a -£1m judgement line and hoped the maths told the right story.
The result?
We were too late to act
We couldn’t clearly explain why numbers moved
Conversations were narrative-driven, not data-driven
The data being discussed didn’t reflect the current state of the business
Leaders knew where deals were in reality — but the system didn’t.
Why I Was Able to Fix It
At the time, I was working as a Sales Operations Analyst for EMEA. I had access to the underlying data, full visibility of the forecasting process, and a front-row seat to how much time was being wasted reconciling numbers instead of acting on them.
I hadn’t solved this problem in a previous role — but I could clearly see that the process and system we were using were no longer fit for purpose.
The insight was simple but powerful:
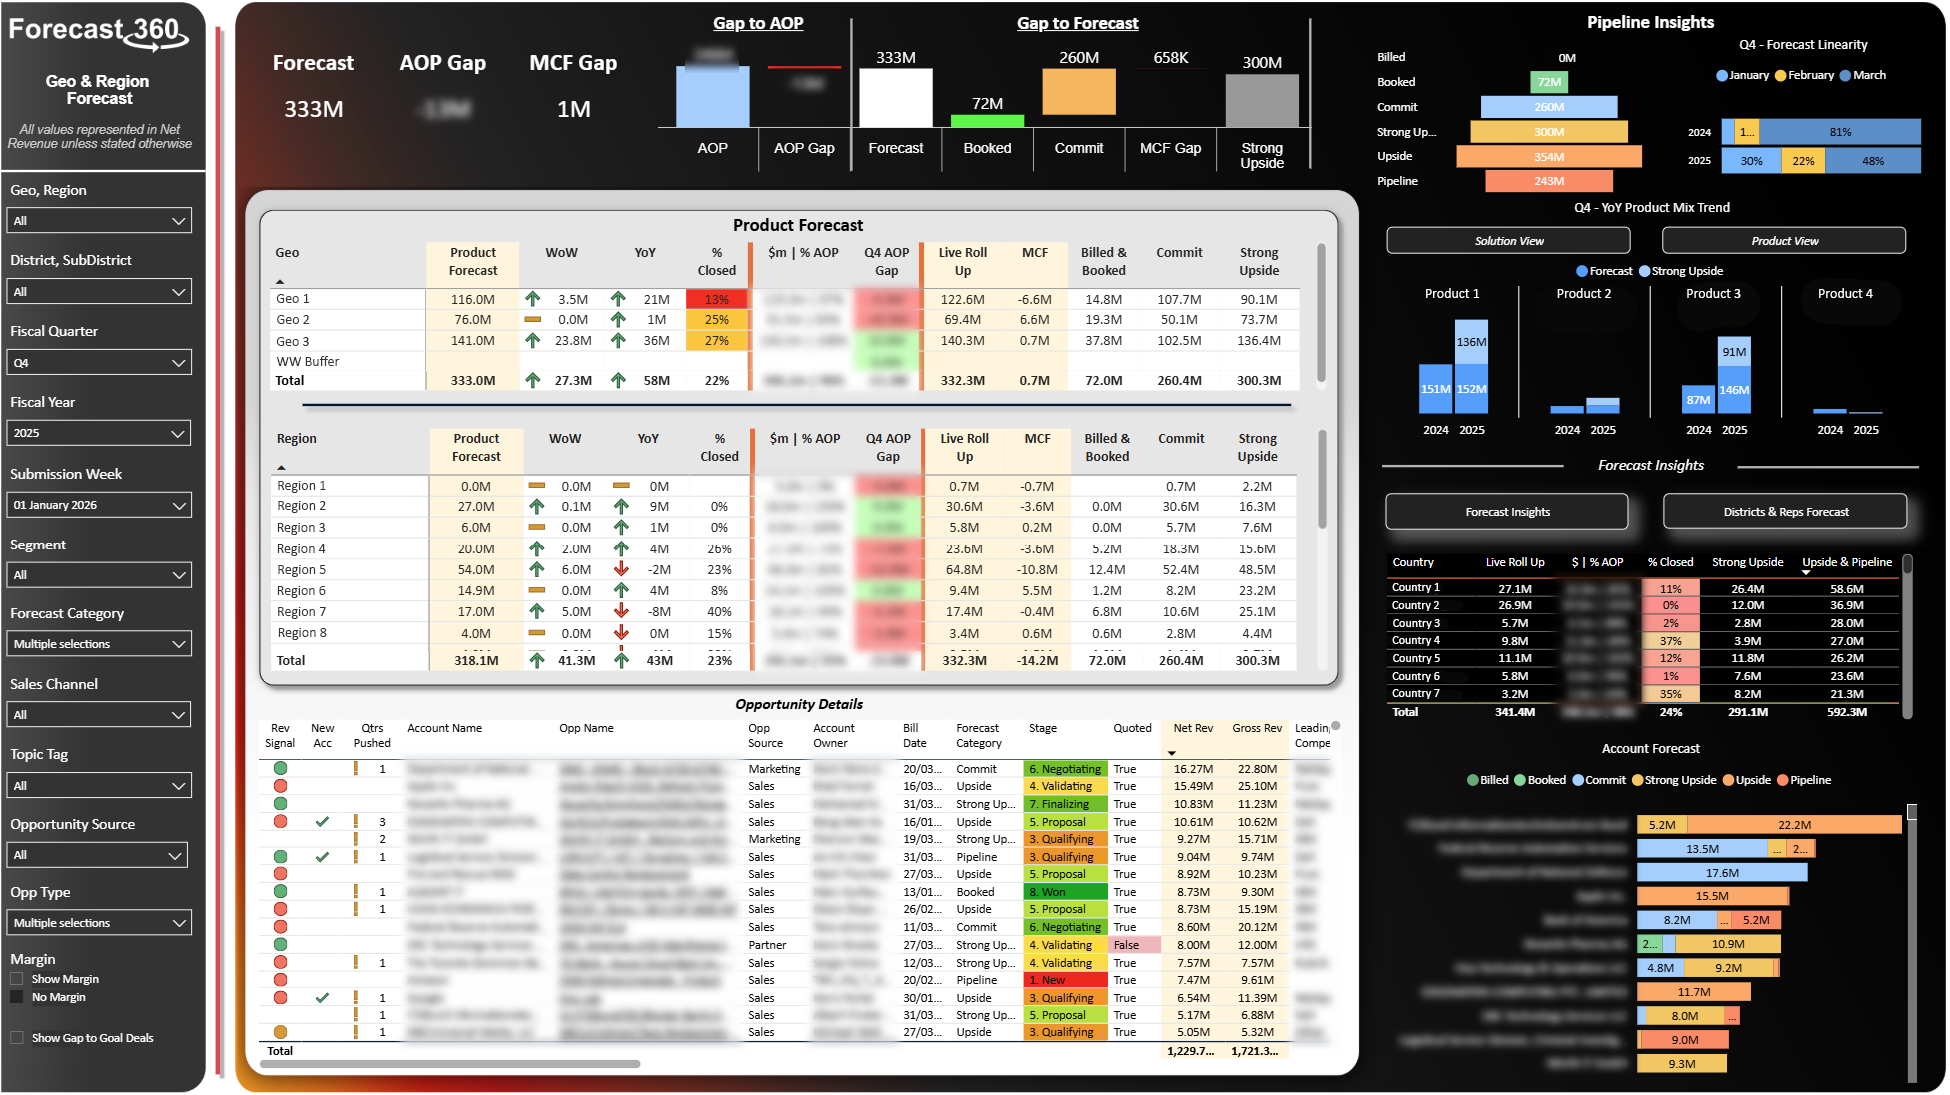
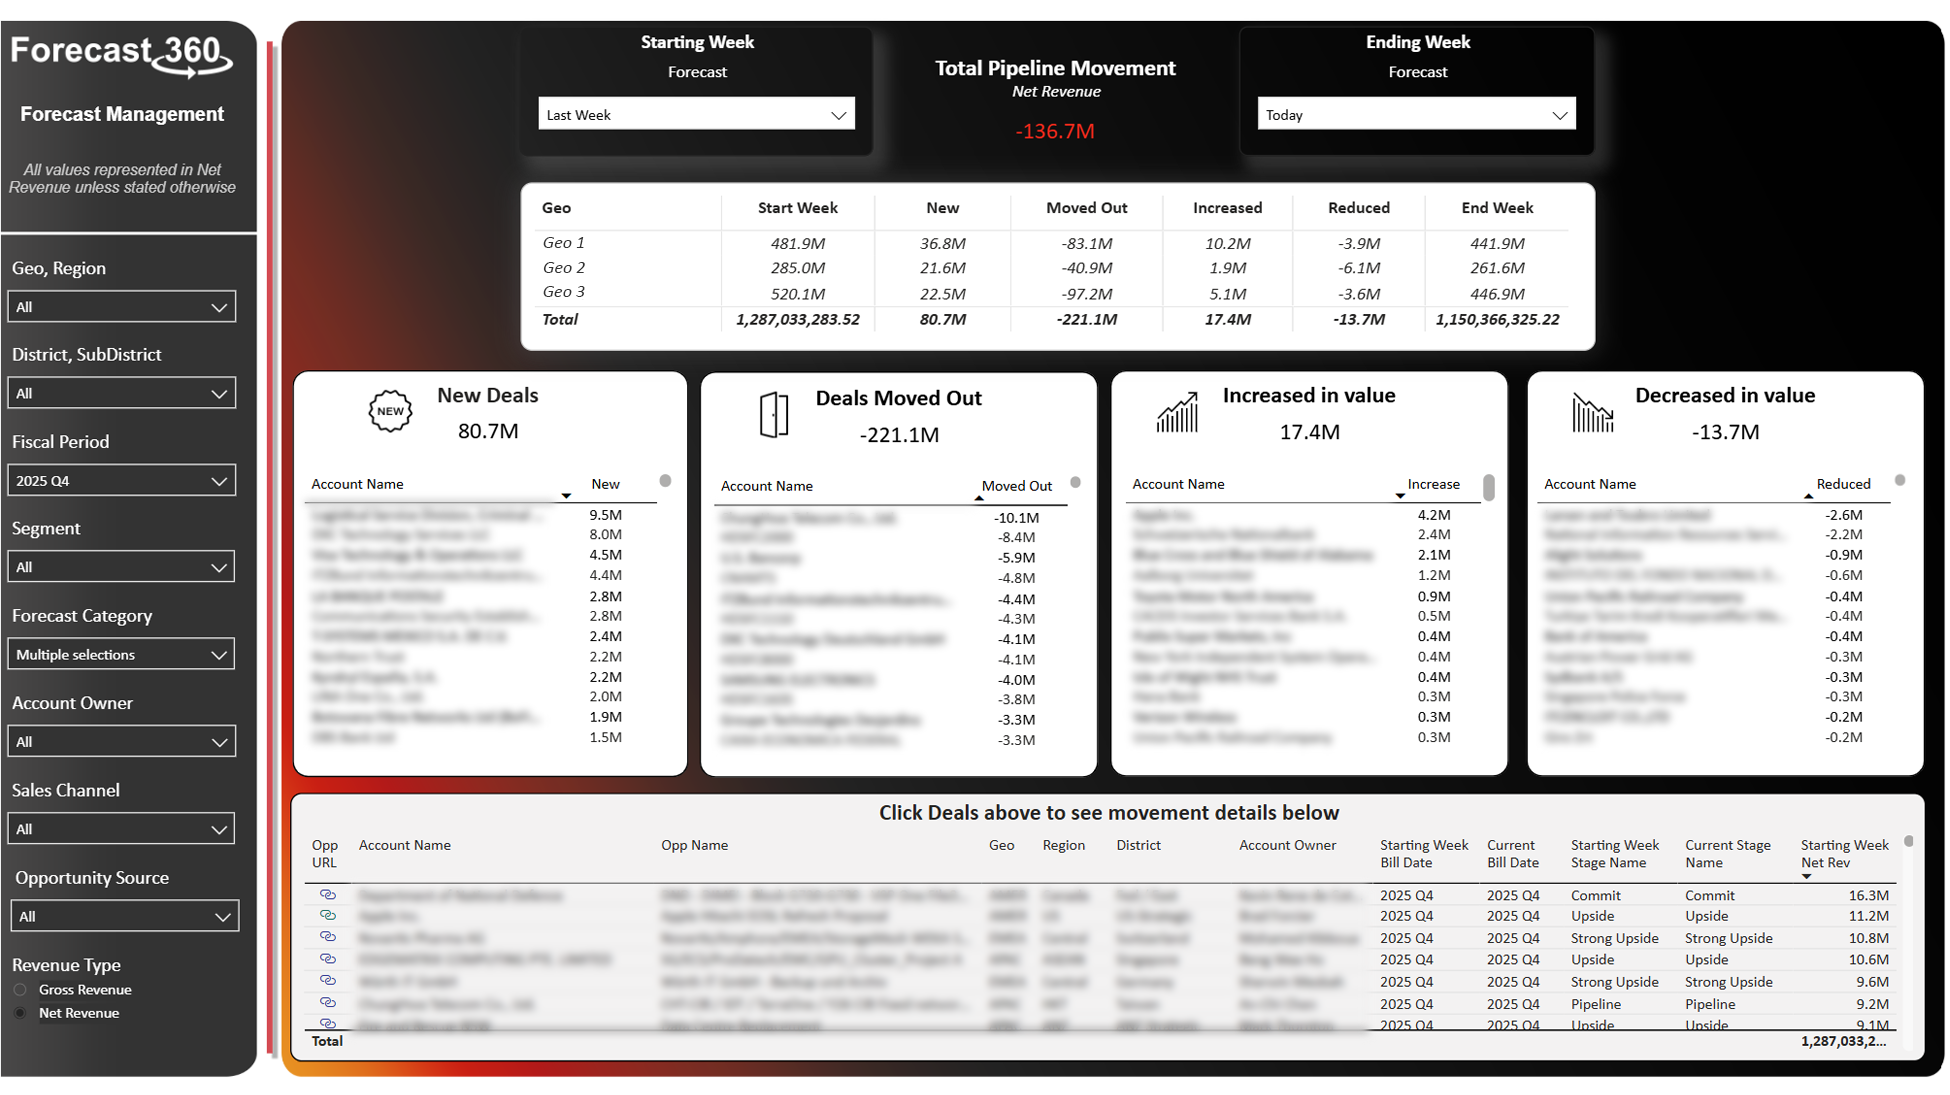
Forecasting should be based on near real-time data and measured against where we need to land — not static snapshots and gut feel.
The Core Insight Behind Forecast 360
The breakthrough wasn’t about building a better report. It was about enabling leaders to talk to near real-time data and directly compare that to progress against our AOP.
Traditional forecasting tools focus on submission, Forecast 360 focuses on the state of the business.
I wanted a tool that:
Reflected reality as it changed
Showed risk early, not after the fact
Enabled better decisions before the quarter was lost
How Forecast 360 Was Built
Forecast 360 started as a side project for EMEA only.
Initially, we ran it alongside the existing forecasting process to compare accuracy and outcomes. Very quickly, it became clear that having more current data changed the quality of conversations and decisions.
The design principles were deliberately simple:
Simplicity – no unnecessary complexity
Speed – insight when it matters, not days later
Near real-time data – evolving from weekly snapshots, to daily refreshes, to four times a day, and now hourly
One intentional decision was what not to focus on:
I didn’t design it for the other geographies. The goal was to solve a real problem well in one region before worrying about scale.
What Makes Forecast 360 Different
In one sentence, Forecast 360 allows leaders to forecast where the business will land at quarter-end and make informed, strategic decisions early — while clearly understanding deal-level risk.
It doesn’t just report numbers, it changes behavior.
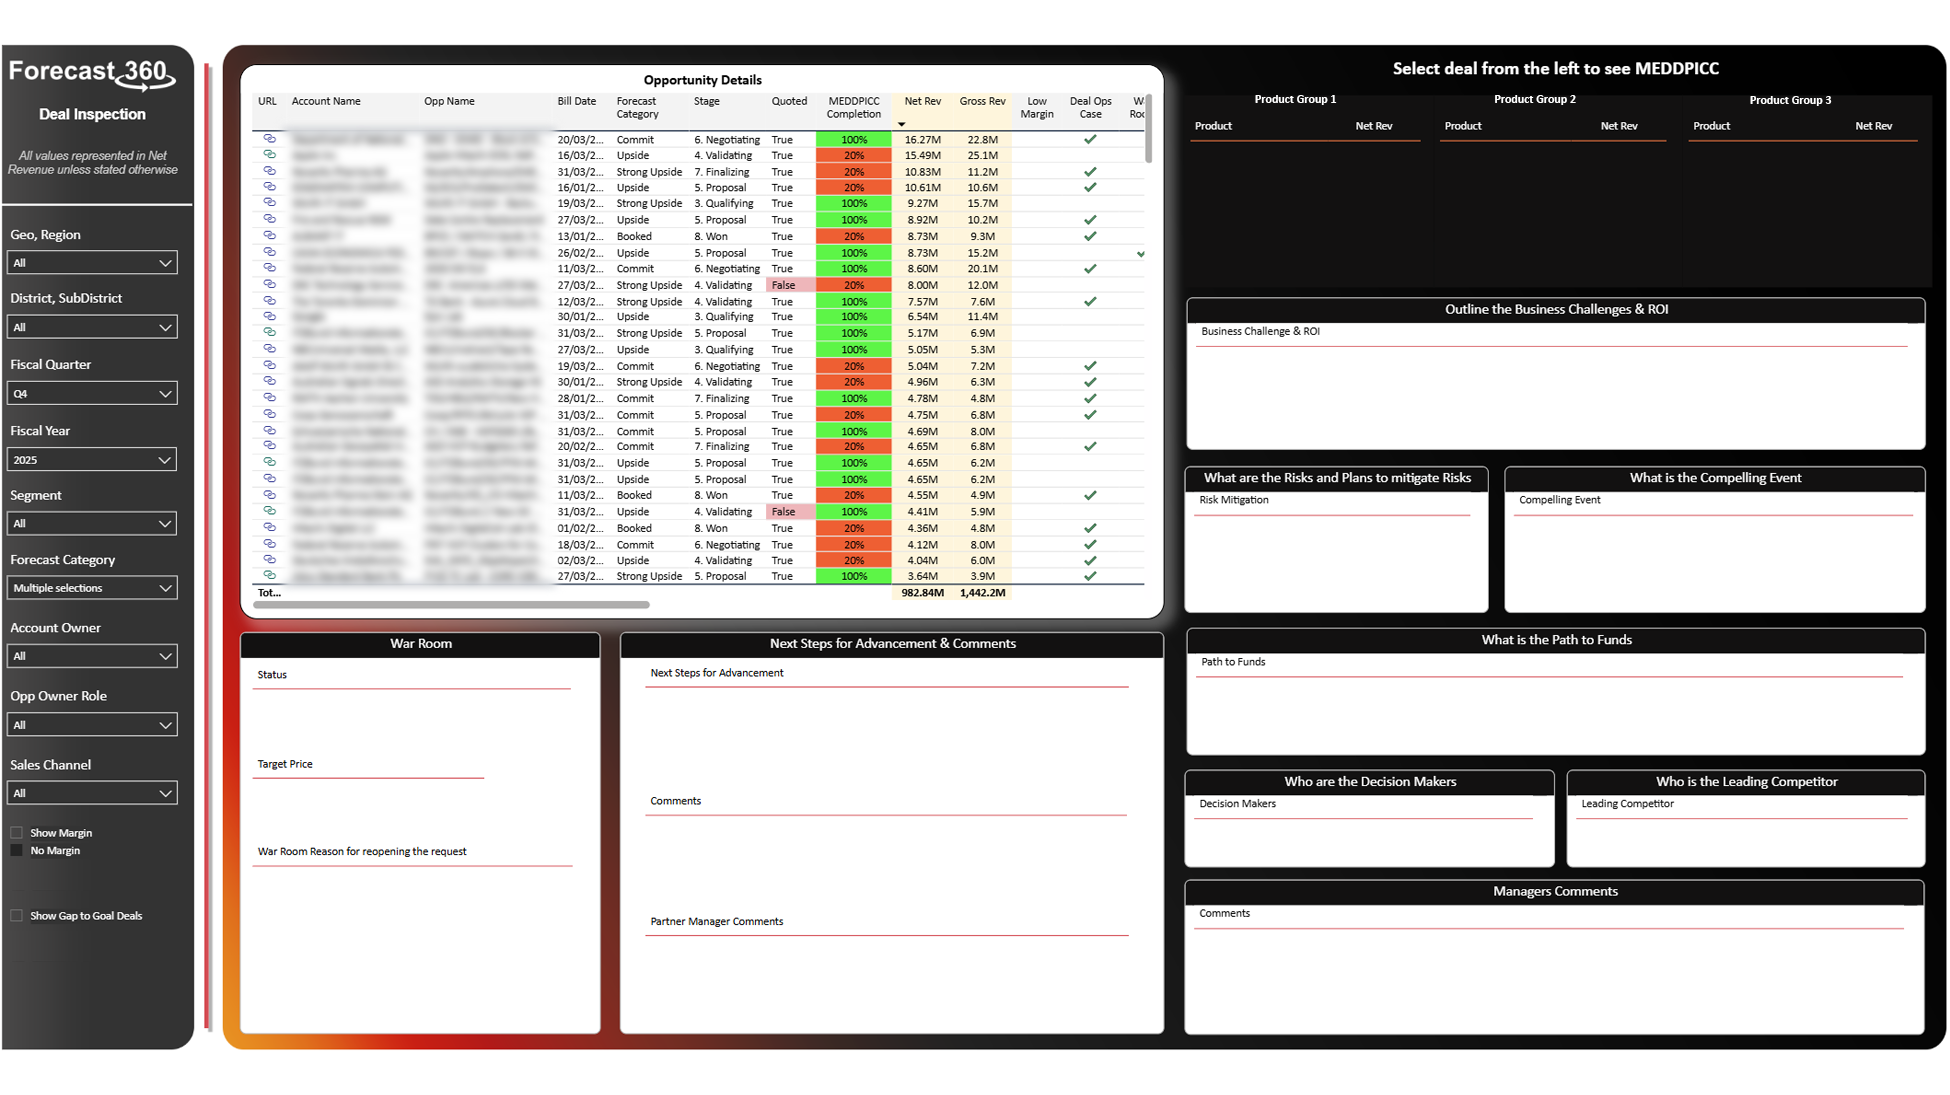
Leaders can see:
Which deals truly matter for the quarter
Where leadership intervention can influence outcomes
Confidence levels and deal timing
Deal configuration and product mix
Risk exposure as it emerges, not after it materialises
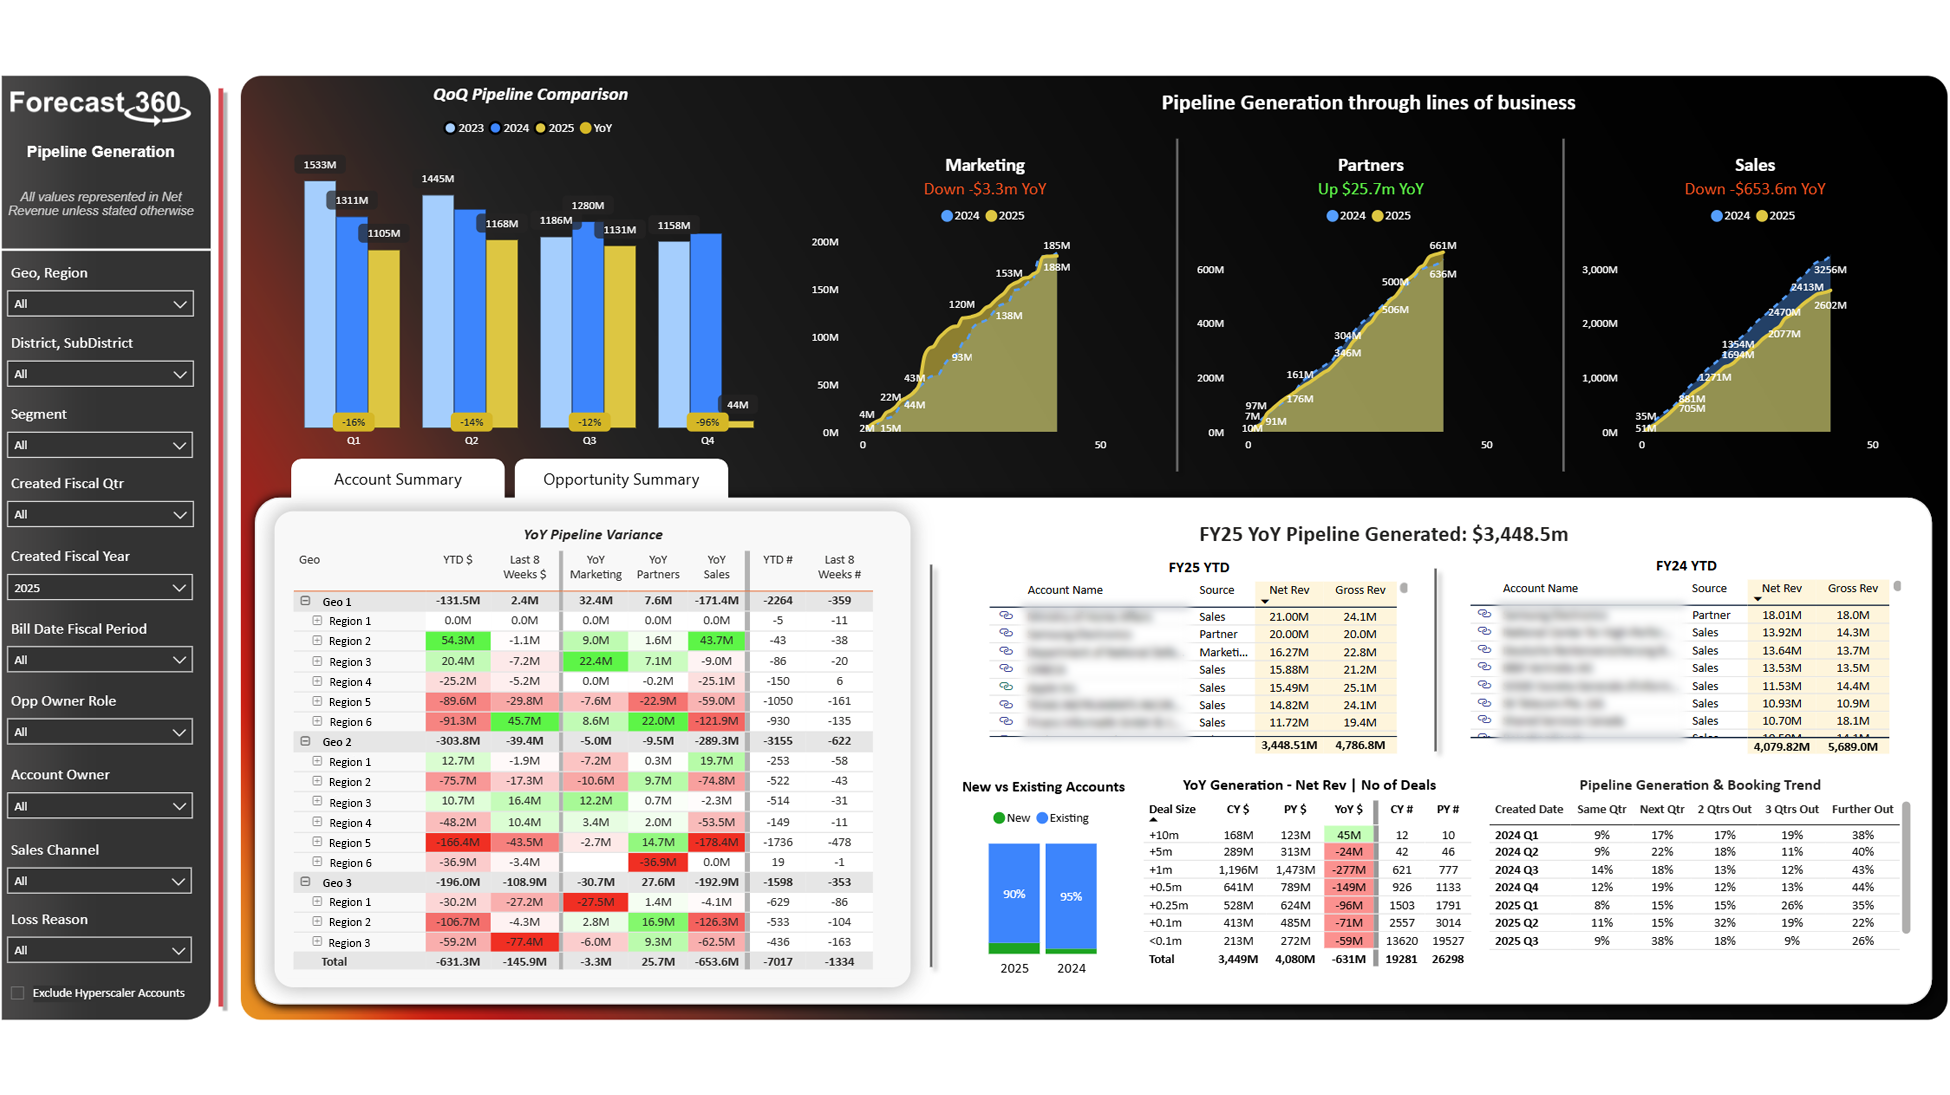
For Finance and Supply Chain, near real-time visibility into deals means tighter profitability tracking and better stock planning at the right time.
What Changed After Implementation
The biggest change wasn’t technical — it was behavioural.
Forecast conversations became more meaningful.
We stopped debating whether the data was right and started discussing what to do about it.
Accuracy improved because risk was identified earlier and mitigated sooner. Forecast updates became clearer, more consistent, and more trusted.
Today:
Forecast 360 is the number one tool used across the company
It has been adopted across all three geographies
Forecast accuracy has materially improved
Executive conversations are focused on action, not reconciliation
The feedback that surprised me most was simple:
“Why has no one ever done this before?”
The Bigger Vision
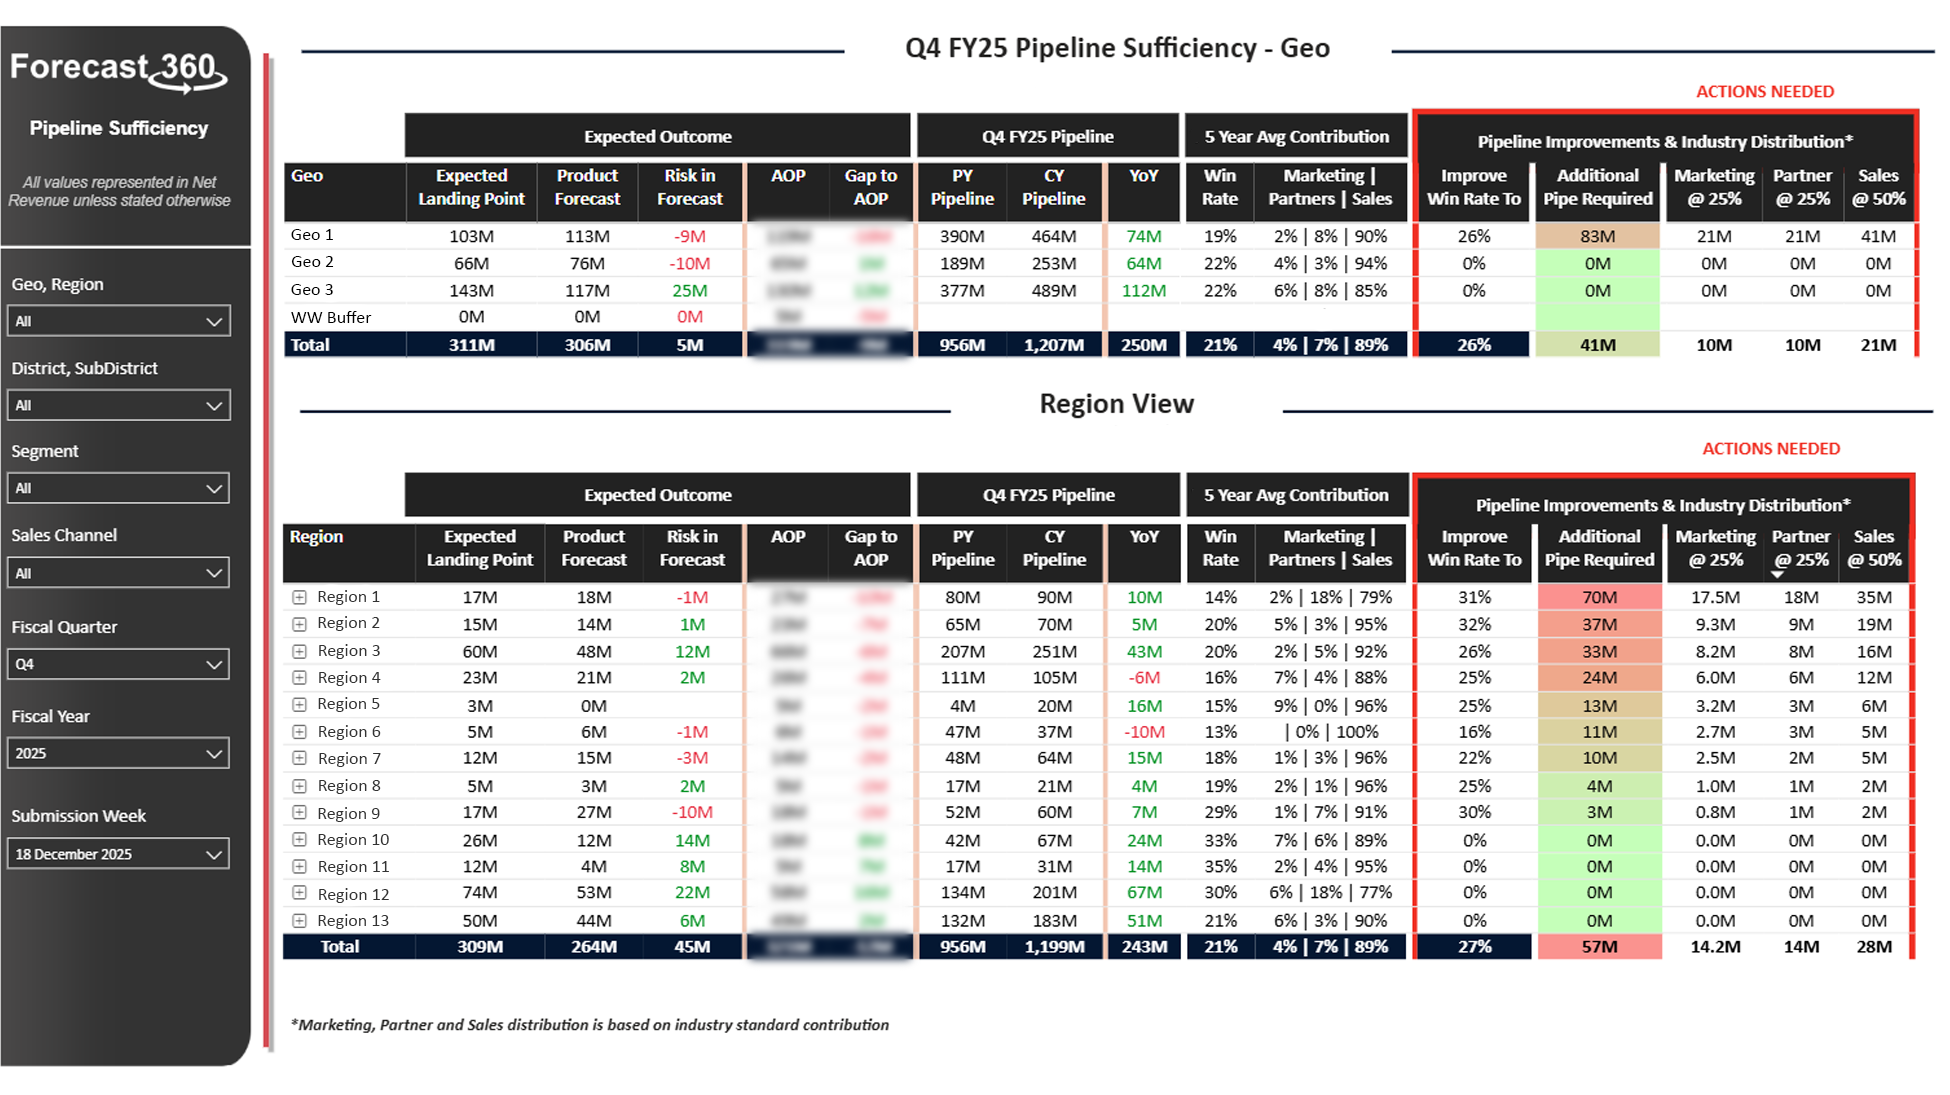
Forecast 360 isn’t just about forecasting the quarter. It’s about moving away from guesswork and towards data-led confidence.
One element of the platform looks at historical performance — such as average win rates over the last five years — and applies that to the current pipeline to generate a data-driven forecast alongside the sales manager’s view.
The aim isn’t to replace judgement, but to anchor it in evidence.
Longer term, the vision is to evolve Forecast 360 into a more predictive model, with deal-level health indicators that surface risk before it becomes visible to the naked eye.
Forecasting should be hard work — but it shouldn’t be a mystery.