
Data Driven MBR’s & QBR’s
Why and How Management 360 Was Born
Management 360 was created to solve a leadership problem that almost every organization faces, important business conversations were being driven by opinions, not evidence.
In MBRs and QBRs, different regions would present different numbers, pulled in different ways, at the last minute. There was no single source of truth, no consistent narrative, and no clear link between performance and action.
Leaders were spending more time debating the numbers than discussing what they actually meant.
The Moment That Exposed the Problem
The real issue wasn’t just inconsistency — it was accessibility.
Performance analysis only really happened inside formal MBRs and QBRs. And in many months or quarters, those meetings didn’t even happen because priorities shifted.
That meant leadership teams didn’t have a reliable way to continuously monitor performance trends. Critical metrics were locked inside slide decks that existed for one meeting and then disappeared.
I wanted core business performance to be accessible at any time, not just when a meeting was scheduled.
What Was Broken With the Old Approach
Before Management 360, MBRs and QBRs were built like this:
each region pulled their own numbers
data was manually compiled into slides
figures rarely matched across teams
preparation took days or even weeks
The biggest problems were:
no single source of truth
different teams showing different numbers
huge effort spent on presentation rather than analysis
purely backward-looking views
And the same questions kept coming up with no clear answers:
Why did we miss?
Where exactly is the risk?
What should we do differently next quarter?
My Role in Building It
My role was to design the blueprint for what we should measure, define what the tool should contain, and secure executive buy-in.
I had seen first-hand how long teams spent gathering information and formatting it into something presentable. The insight was the same as with the other tools I built:
We already had the data. What we didn’t have was ownership, structure and a usable design.
So I took ownership and built it.
The Core Insight Behind Management 360
The key realization was simple, Leaders don’t need more summaries. They need early signals.
Most management reporting is designed to show data.
Management 360 was designed to tell a story with data.
Each section flows logically:
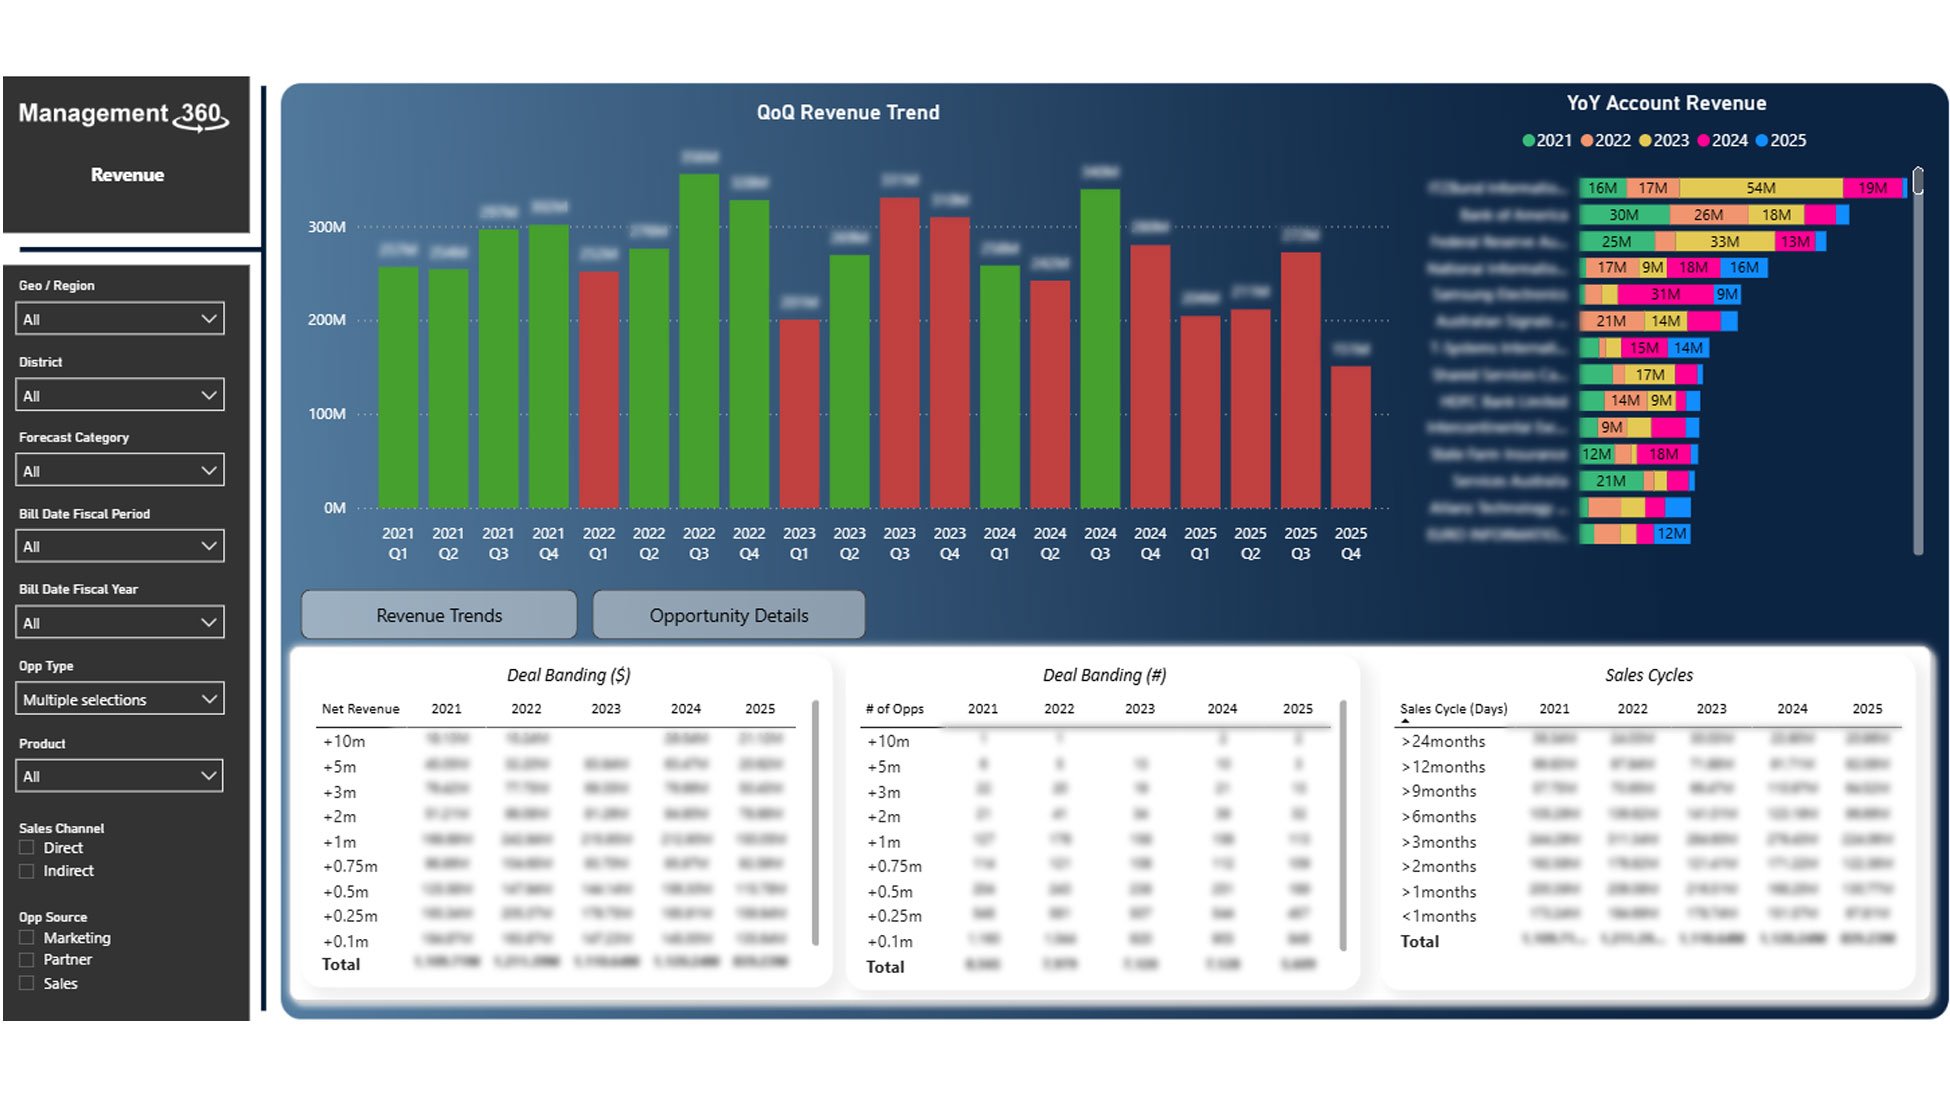
Revenue
Core Product Sales
Pacing
Forecast
Risk
So leaders aren’t just looking at isolated metrics — they are following the narrative of how the business is performing and why.
The goal wasn’t to create another BI dashboard.
It was to enable deeper understanding of trends and performance drivers.
How Management 360 Was Built
Management 360 started as a pilot for a single geography. Once the value was proven, it expanded globally.
The design principles were:
Clarity – no noise, only what matters
Comparability – same metrics for every region
Actionability – insights, not just charts
One deliberate decision was to exclude margin. Profitability was left with Finance to ensure it remained accurate and governed, rather than diluted through assumptions.
What Makes Management 360 Different
In one sentence:
Management 360 makes leadership data for MBRs and QBRs continuously available and creates consistent, data-driven conversations across the organization.
It fundamentally changes leadership behavior.
Instead of gut feel and anecdotal explanations, leaders now have:
performance drivers
early risk indicators
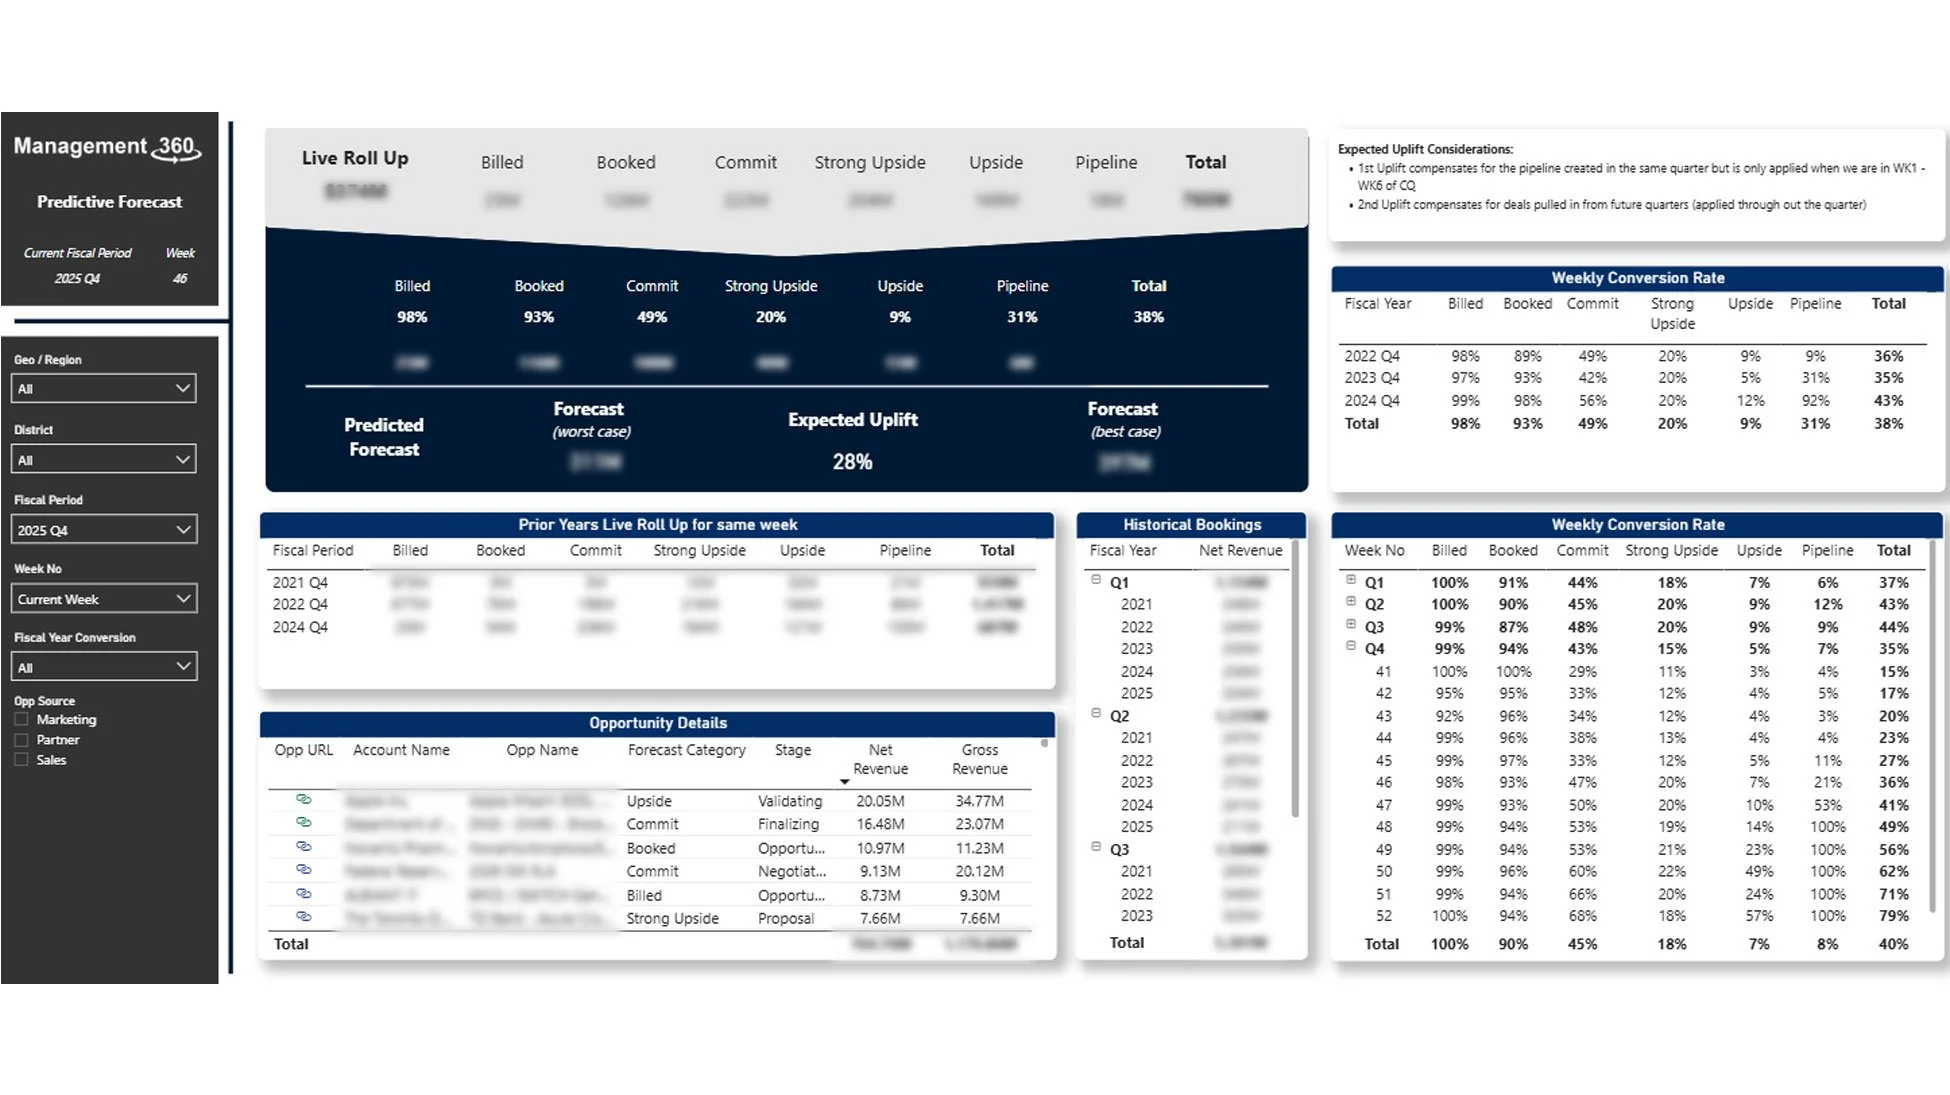
predictive forecasts
capacity sold vs cost trends
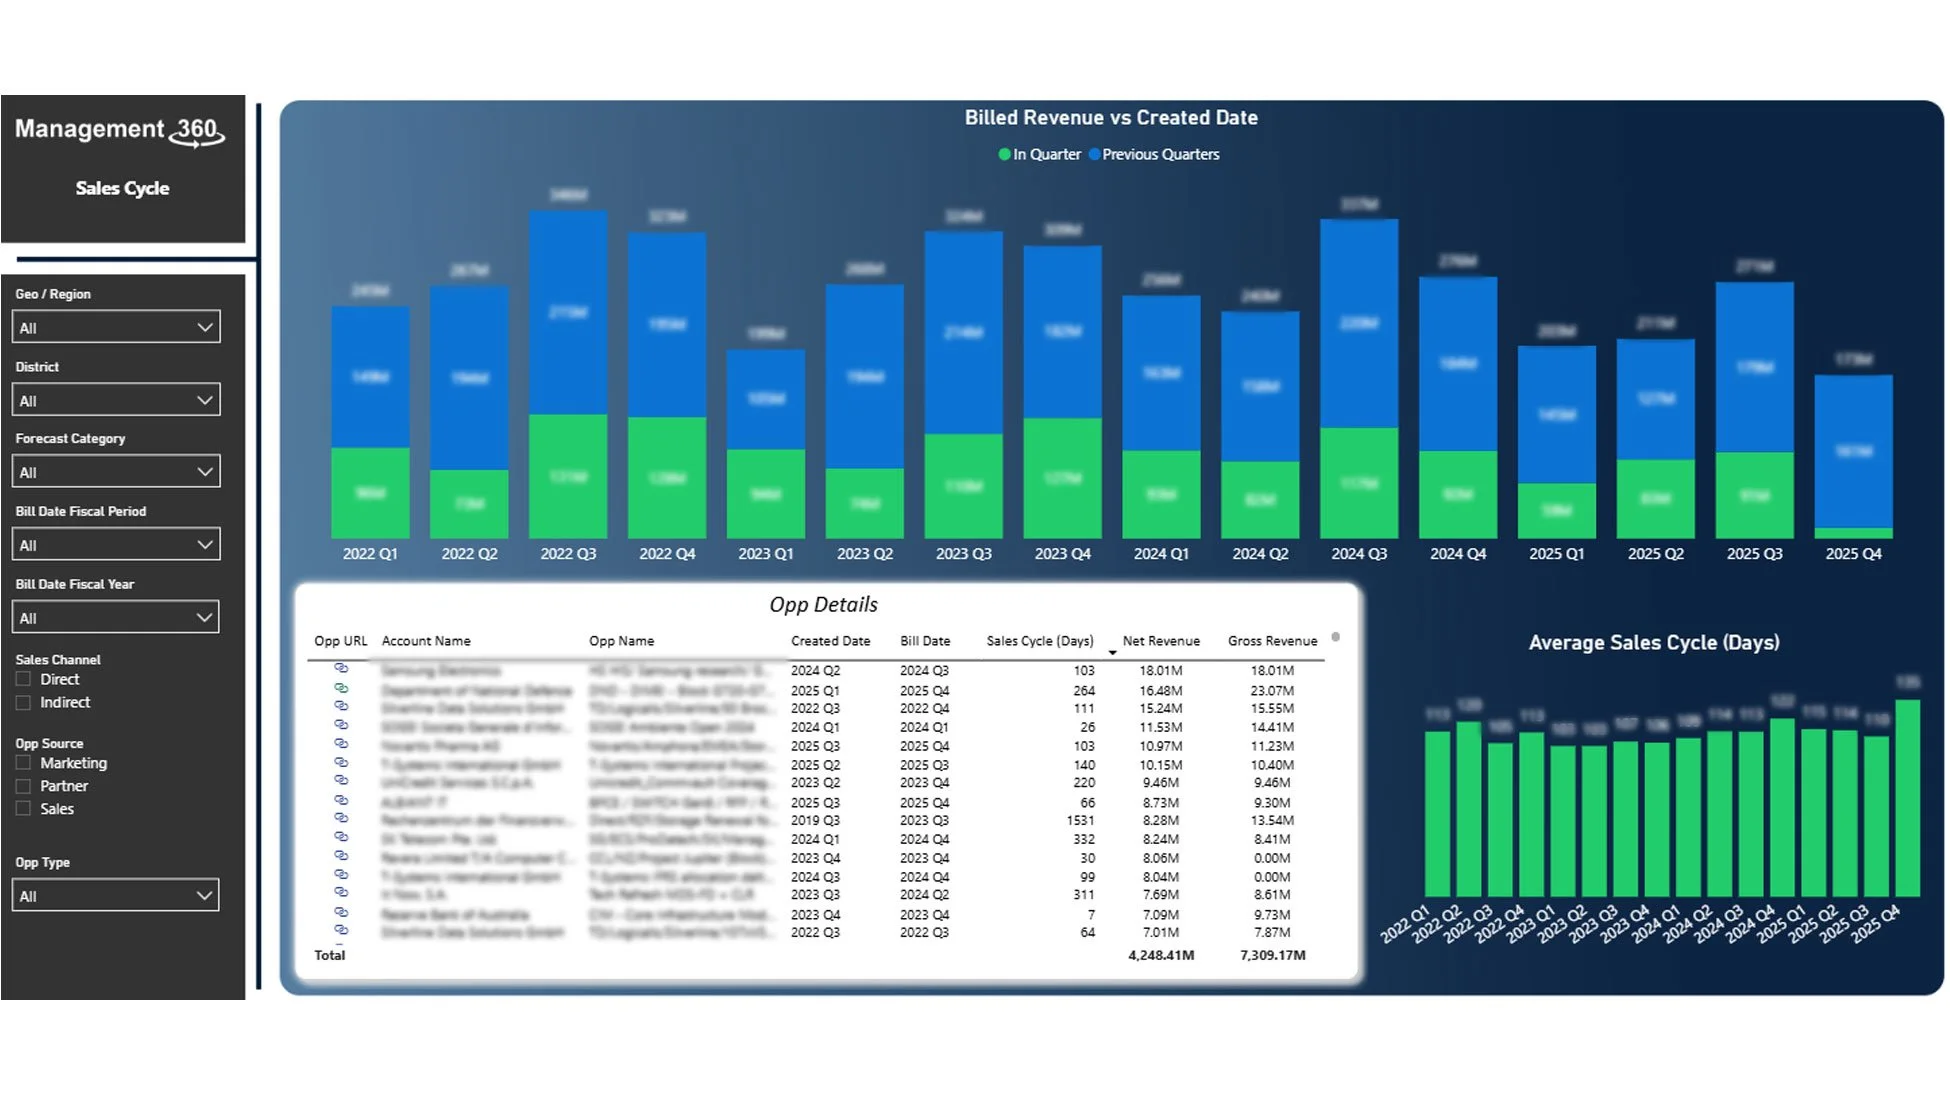
sales cycle analysis
Three of the most critical views are:
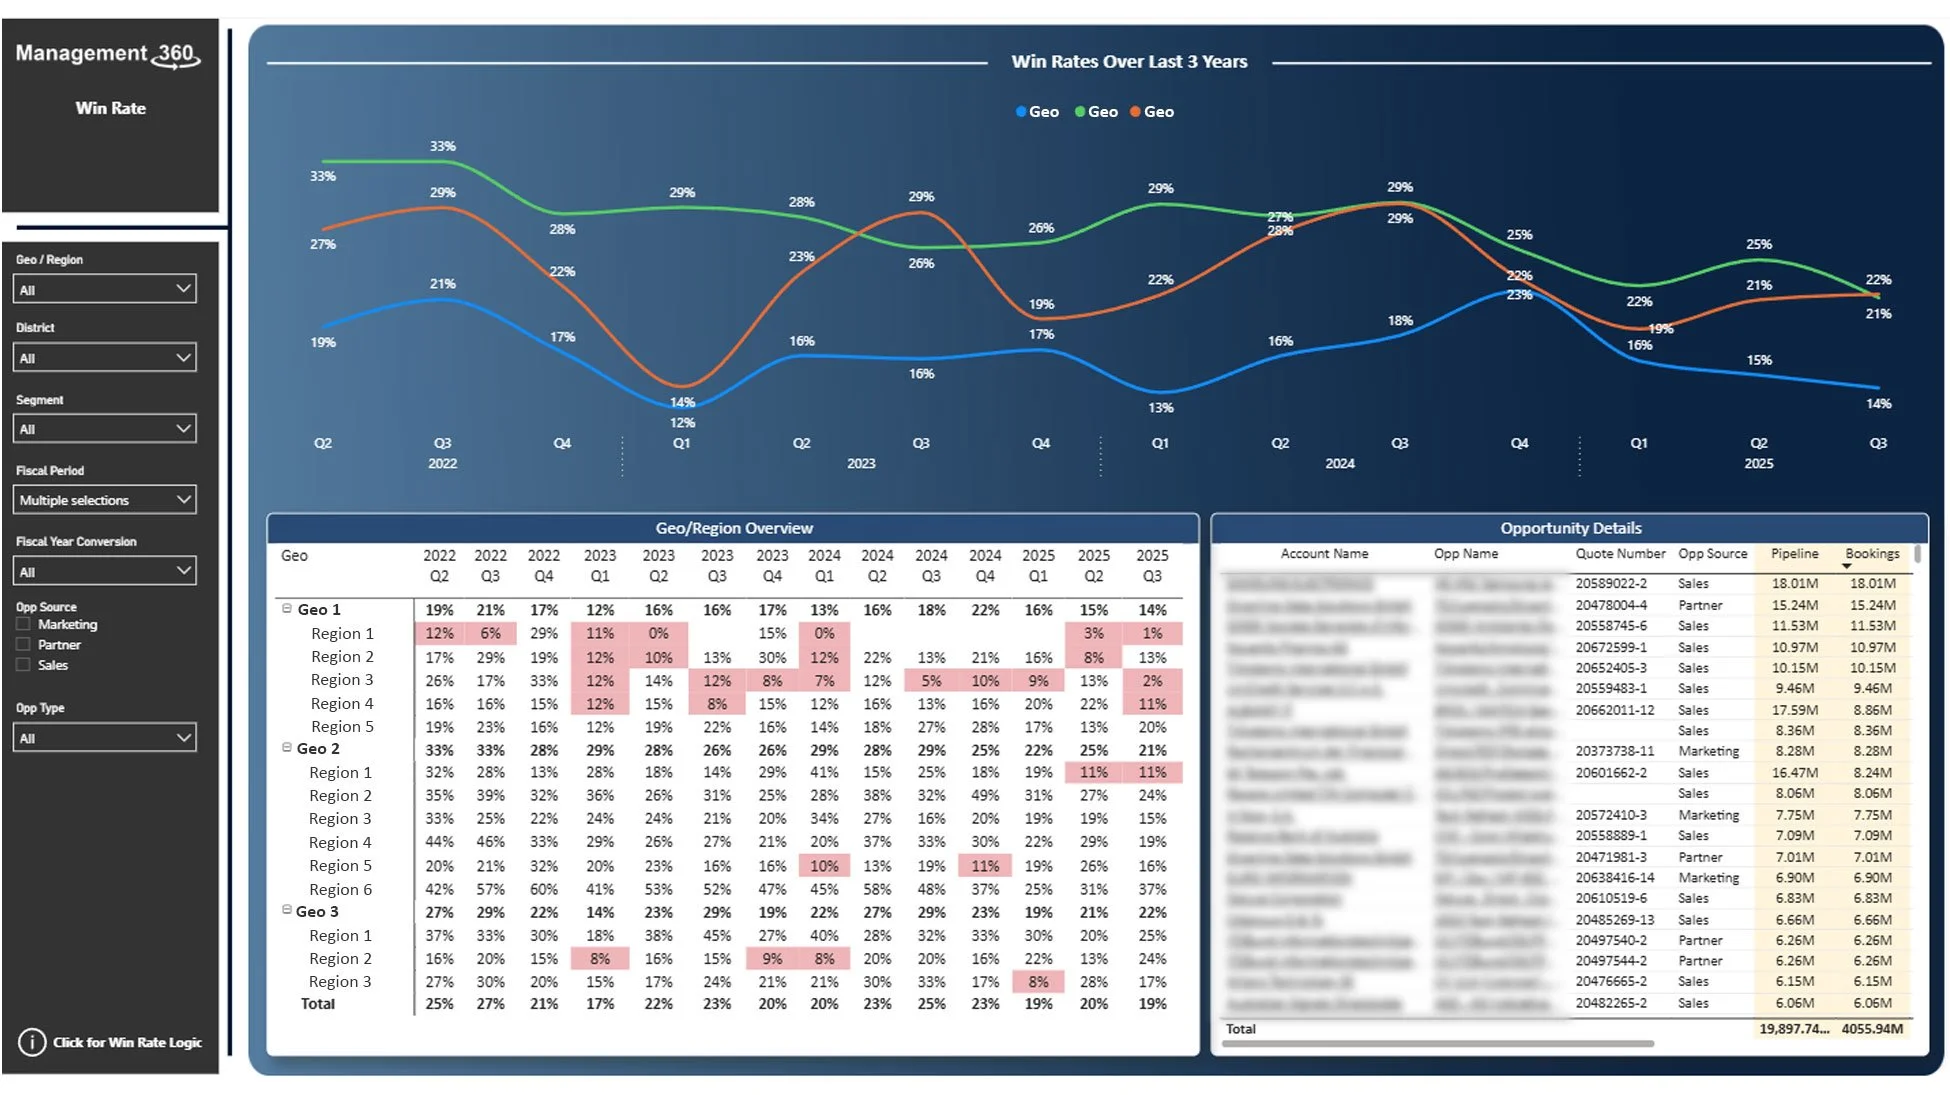
Capacity Sold – ensuring profitability as cost of drives increases
Sales Cycles – identifying bottlenecks in execution
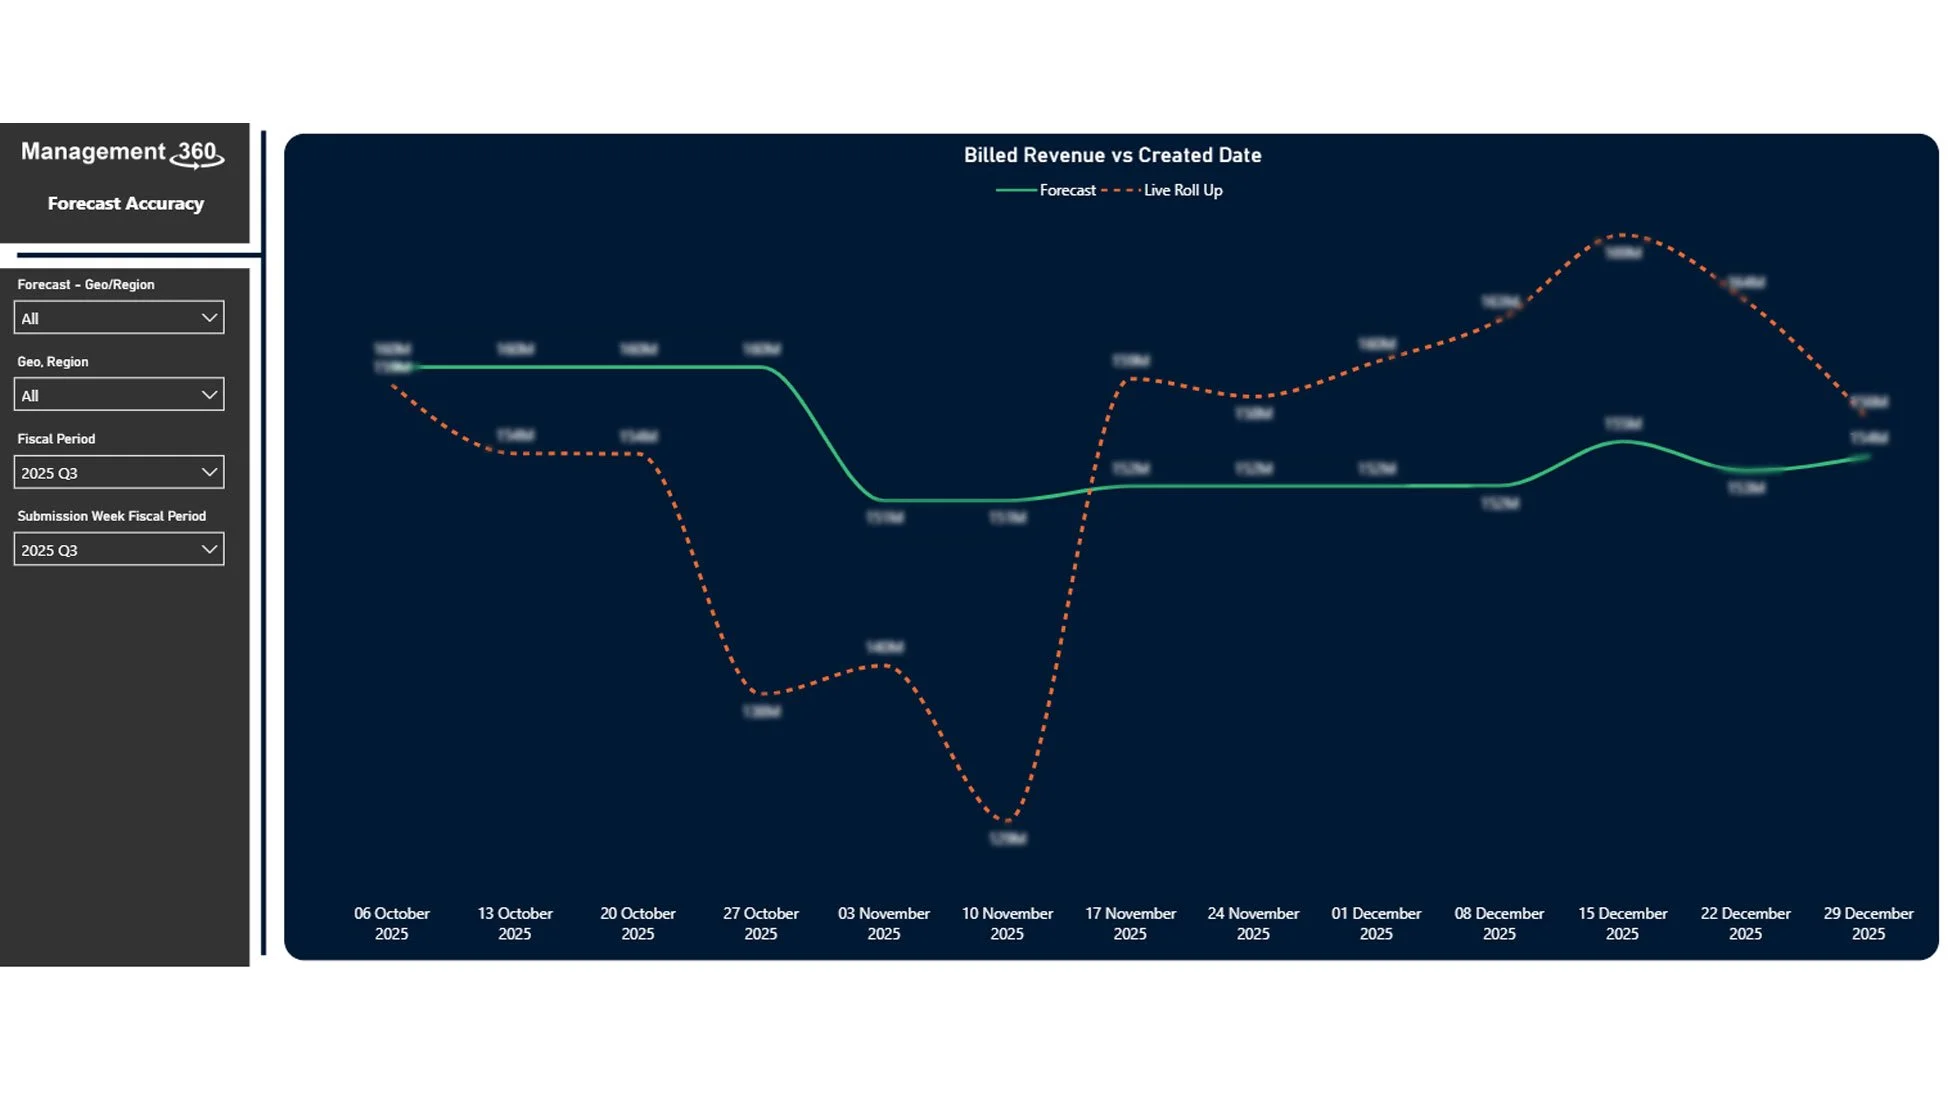
Predictive Forecast – understanding likely outcomes, not just targets
The Impact
The biggest change wasn’t in reporting — it was in the quality of conversations.
Leadership discussions became more meaningful because there was finally data to support or challenge theories.
A very tangible outcome was time:
MBR/QBR preparation dropped from over a week to two days
But more importantly:
leaders could now understand the health of their business at any time
without searching across multiple systems
without waiting for a meeting
The feedback from executives was consistent:
“It’s the first time we can all have the same conversation, using the same data.”
The Bigger Vision
Management 360 is ultimately about one thing:
creating a single source of truth for meaningful leadership conversations.
It aligns with my broader philosophy around data and accountability:
data should enable fact-based decision-making, scenario planning and outcome-driven strategy.
Not just for internal reporting — but for shaping how leaders think about the business itself.
As company strategy evolves, Management 360 continues to evolve with it. The structure stays the same, but the questions it answers adapt to what matters most.
The tool doesn’t replace leadership judgement.
It simply ensures that judgement is grounded in reality.